
Customer Concentration Risk in Due Diligence: Do the 10%, 15% and 25% Thresholds Matter?
Why customer concentration thresholds disagree (10%, 15%, 25%), where 10% comes from, and three tests that matter in due diligence. Example worked case.
On This Page
The target's information memorandum says no customer is more than 15% of revenue. One guide you read says concentration becomes a problem at 10%, another at 15%, a third at 25%, and the top five should be under 40% or perhaps 50%. Your lender has its own view. You need to decide whether this target's customer concentration risk matters for this deal, and how to measure it so the committee can rely on the number.
This page explains where the thresholds come from, why they disagree, and why none of them answers the question a deal team is asking. It then sets out three tests that do, and works them through a sample target with the arithmetic shown.
In short
- The 10% figure has a real source: IFRS 8 requires a company to disclose reliance on any single external customer that provides 10% or more of its revenue. It is a disclosure trigger, not a risk limit.
- The same rule treats a group of entities under common control as one customer. Many concentration tables in information memoranda do not.
- The 15% and 25% figures, and the 40% to 50% top-five figures, appear in published guides without a cited source. Treat them as rules of thumb.
- No percentage tells you whether concentration matters. Three tests do: measure by owner, read the terms, and size the contribution at risk against EBITDA (earnings before interest, tax, depreciation and amortisation), debt and the plan.
- A customer that is 20% of revenue can carry about half of EBITDA if the business has high fixed costs. That is the number the committee needs.
Where the 10% comes from
IFRS 8, the international standard on operating segments, includes a paragraph on information about major customers. If revenues from transactions with a single external customer amount to 10 per cent or more of an entity's revenues, the entity must disclose that fact, the total revenue from each such customer and the segments reporting it (S1). It does not have to name the customer.
The same paragraph adds a grouping rule: a group of entities known to the reporting entity to be under common control "shall be considered a single customer" (S1). For bodies under one government, the paragraph as amended in 2009 calls for judgement, based on how economically integrated they are (S4).
Two consequences follow. First, 10% is the point at which a reader of the accounts is told about reliance on a customer. The standard does not say that 10% is dangerous or that 9% is safe. Second, a concentration table that counts invoiced accounts, rather than groups, is not even measuring concentration the way the accounting standard does.
In the US, the SEC's Regulation S-K asks registrants to describe their business, including any dependence on key customers, without fixing a percentage; for smaller reporting companies it lists "dependence on one or a few major customers" (S2). Dependence is a matter of materiality, not a line on a chart.
Last checked: 8 October 2026. This is commercial guidance, not accounting or legal advice.
Where 15% and 25% come from
When PhaseVane reviewed the pages ranking for "customer concentration risk due diligence" on 8 October 2026, the guides used 10%, 15% and 25% for the largest customer and 40% to 50% for the top five. Most gave no source. Some ranking pages were a personal profile and automated prompt pages, which says more about how thin the subject is than about the right number.
Rules of thumb are not useless. They tell you what lenders and buyers often look at first. But a target can sit under every threshold and still have a customer whose loss would breach a covenant, and another can sit above all of them with customers locked into multi-year contracts and high switching costs. The threshold debate is the wrong argument.
Three tests that matter
1. Measure by owner, not by account. Group invoiced accounts by ultimate owner, using company registry extracts and the customer's own group structure. Count agencies and distributors that buy for one end customer with that customer where the decision sits with them. This is the IFRS 8 grouping logic applied to a due diligence table.
2. Read the terms. For each large customer, find what the contract says about volume commitments, term, notice, exclusivity and price reviews, then compare it with behaviour: 36 months of orders, any tenders the customer has run, any share moved to competitors. A contract with a minimum volume and two years left is different from a framework agreement with three months' notice, even at the same revenue.
3. Size the contribution at risk. Revenue share is the wrong unit for risk. Multiply each customer group's revenue by the contribution margin it earns (revenue less the costs that would disappear with it), and compare the result with EBITDA, debt service headroom and the growth plan.
A worked example
Company C is a UK manufacturer of printed packaging for food brands. FY26 revenue is GBP 24.0 million and EBITDA GBP 3.1 million. Its information memorandum says: "No customer accounts for more than 15% of revenue; our top five customers are 44%."
By account. The revenue ledger, reconciled to the audited accounts (Verified), shows the five largest invoiced accounts:
| Account | Revenue, GBP m | Share |
|---|---|---|
| R1 | 3.12 | 13.0% |
| R2 | 2.40 | 10.0% |
| R3 | 1.92 | 8.0% |
| R4 | 1.68 | 7.0% |
| R5 | 1.44 | 6.0% |
| Top five accounts | 10.56 | 44.0% |
On those terms the claim holds: the largest account is 13.0%, and the top five are 10.56 / 24.0 = 44.0%.
By owner. Registry extracts show that R1 and R4 are subsidiaries of one food group, Group H (Verified as filed; Companies House states that it does not check the accuracy of filings, S3). Group H's framework agreement is signed by its central procurement team (Verified), so one decision governs both accounts. Group H is 3.12 + 1.68 = GBP 4.80 million, or 4.80 / 24.0 = 20.0% of revenue. The top five owners (Group H, R2, R3, R5 and the next account, R6 at GBP 1.20 million) total 4.80 + 2.40 + 1.92 + 1.44 + 1.20 = GBP 11.76 million, or 49.0%.
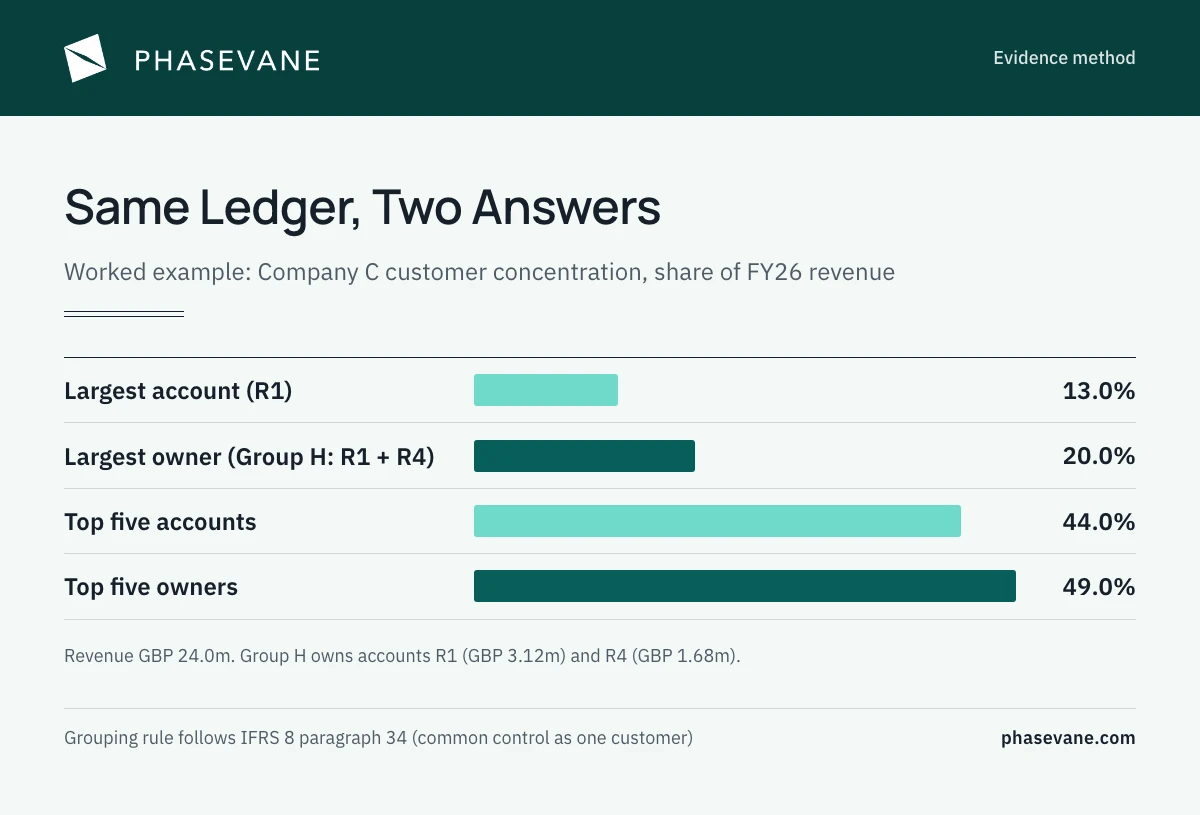 *The same ledger, counted two ways.*
Terms and behaviour. Group H buys under a framework agreement with no volume commitment, an annual price review and three months' notice on either side (Verified). R2, by contrast, has a three-year supply agreement to 2028 with a minimum annual volume (Verified). Order history over 36 months shows Group H's spend stable (Verified). Management says Group H is running a "routine review" of packaging suppliers in 2026 (Supplier-stated); no timetable was provided (Unknown).
Contribution at risk. Company C earns a contribution margin of about 32% on Group H's work (Estimated from the product cost file). If Group H left, about 4.80 x 0.32 = GBP 1.536 million of contribution would go, against EBITDA of GBP 3.1 million: 1.536 / 3.1 = 49.5%. With three months' notice, most fixed costs could not be cut in time.
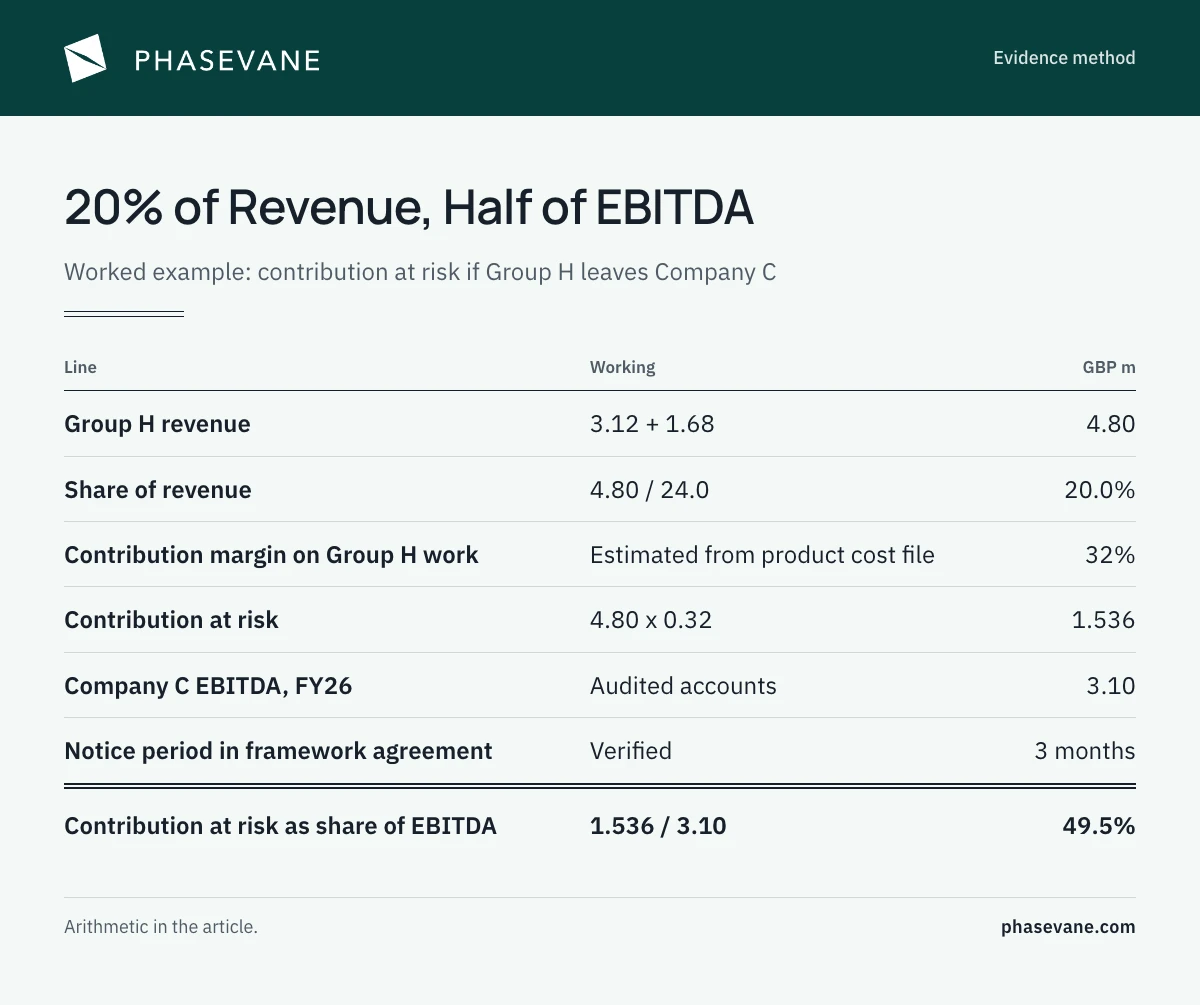 *Twenty per cent of revenue, about half of EBITDA.*
The finding.
| Element | Reading |
|---|---|
| Status | Holds by account (13.0%). Does not hold by owner: Group H is 20.0% of revenue |
| Contradiction | Claim vs evidence, explained: the claim counts invoiced accounts; two share an owner and a buying decision |
| Confidence | Moderate. Revenue and ownership rest on Verified records; the status of Group H's supplier review is unknown and material |
| Commercial implication | Group H carries about GBP 1.5 million of contribution, about half of EBITDA, on three months' notice |
| Action | Test. Ask for the timetable and scope of Group H's review and any correspondence; model a downside without Group H; ask counsel how the warranty should define a customer |
The threshold debate would have told the committee that 13% is fine. The three tests tell it that one buying decision at one food group carries half the profit.
Data checks before you build the table
- Reconcile first. The revenue-by-customer extract should add up to audited revenue for the period. If it does not, find out why before you calculate shares.
- Use enough history. Twelve months can hide a customer that is shrinking. Use 36 where you can, by quarter.
- Check credit notes and rebates. Large retrospective rebates can make a customer look bigger on invoices than on net revenue.
- Group consistently. Apply the same ownership rule to every account, and write it down. If the information memorandum's table and yours differ, that difference is a contradiction to log: see contradictions in due diligence evidence.
- Grade each input. Ledger data reconciled to accounts is Verified; a management statement about a relationship is Supplier-stated. The grades set the confidence, as explained in evidence grading for commercial decisions.
The same logic on the supply side
Supplier concentration has the same trap in reverse. A target that says no supplier is above 15% of purchases may be counting supplier accounts that share a parent. The method in supply chain due diligence in an acquisition groups suppliers by owner in the same way. Both belong in the claims list of any commercial due diligence scope, and both should reach the committee as one line each in the decision memo template: status, confidence, action.
Do it yourself, or have it done
If the claim sits on a threshold that moves the price, and you want a second reader independent of the deal team, a PhaseVane Decision Brief reads the target's claims against its data under NDA, from GBP 3,500: commission a Decision Brief.
Sources (checked 8 October 2026): IFRS 8 paragraph 34 as adopted by Commission Regulation (EC) No 1358/2007, https://www.legislation.gov.uk/eur/2007/1358/annex; IFRS 8 paragraph 34 as amended by Commission Regulation (EU) No 632/2010, https://www.legislation.gov.uk/eur/2010/632/annex/appendix/division/A1/division/34/adopted; 17 CFR 229.101, https://www.ecfr.gov/current/title-17/chapter-II/part-229/subpart-229.100/section-229.101; Companies House search service, https://find-and-update.company-information.service.gov.uk/.
Related Research
See all research notesTopic: Customer and Revenue Claims
Supply Market Analysis for a Decision: Which Assumptions Hold?
Supply market analysis that answers an investment or strategy decision: five questions, the evidence for each, and a sample worked read on resin supply.
Supply Market AnalysisRead MoreEvidence Grading: How Much Weight Can a Claim Bear?
An evidence grading system for deal and commercial decisions: six grades, confidence ceiling rules, and what to borrow from UK intelligence assessment.
Evidence GradingRead MoreCommercial Due Diligence: Which Claims Hold Up?
Commercial due diligence for deal teams: the claims it must test, the evidence that settles each, and how to state confidence and gaps before the IC.
Commercial Due DiligenceRead More